


Photo by Luke Chesser on Unsplash
Data Engineering Explained
A simple introduction to Data Engineering


When we scroll through these sites in hopes to find something we need to buy (say, a shirt), we add it to the cart, or we just let it be saved for later. Within a few moments, you begin to see advertisements of the same or similar-looking shirts while surfing other platforms.
For these creepy advertisements to be in the right spots, apart from data tracking using cookies, there is also a good amount of data engineering working behind the scenes.
In this blog post let's try to understand how data engineering works.
Data Engineering in the Past
First, let's try to understand data engineering in the past. A while back, when things were simple, data was scattered across multiple sources such as transaction databases (e.g. MySQL, Postgres), analytics tools (e.g. Google Analytics, Facebook Pixels), and CRM databases. This data was often accessed and analyzed by an Excel professional who would gather the data from various teams, manipulate it in Excel using pivot tables and other functions, and create a final report.
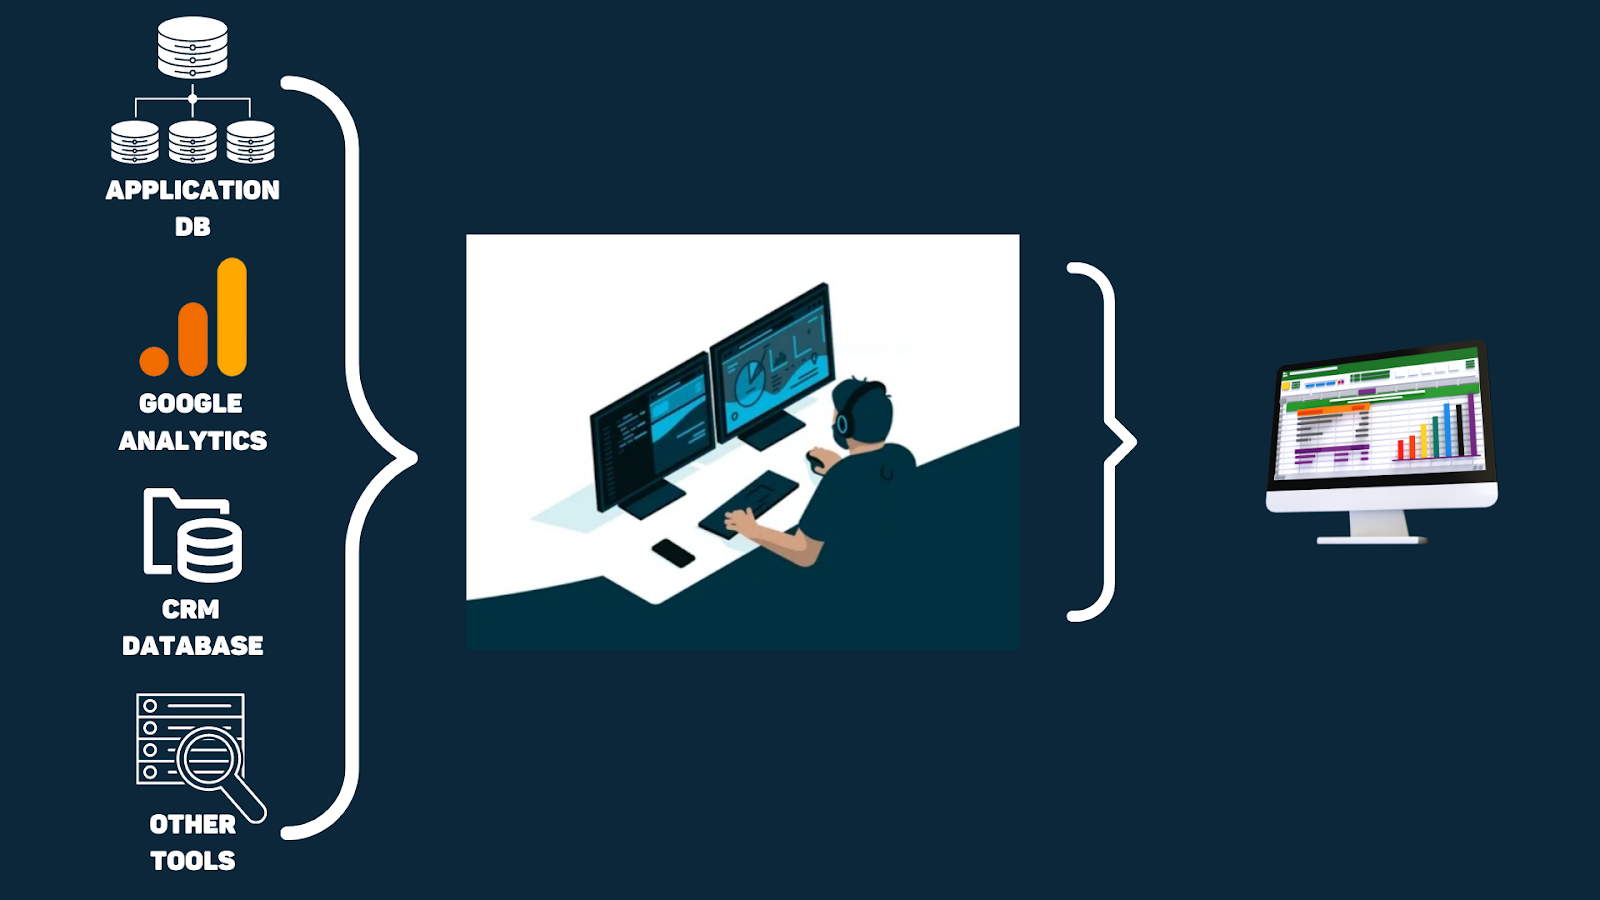
While this process worked for small applications, it was prone to error due to the manual intervention involved and became increasingly cumbersome as the amount of data grew.
Understanding Extract Transform Load (ETL)
Extract, Transform, Load (ETL) is a process in data engineering that involves extracting data from various sources, transforming it into a format suitable for analysis or other purposes, and loading it into a target system or database. The purpose of ETL is to make it easier to work with data from different sources by bringing it into a centralized location or format.
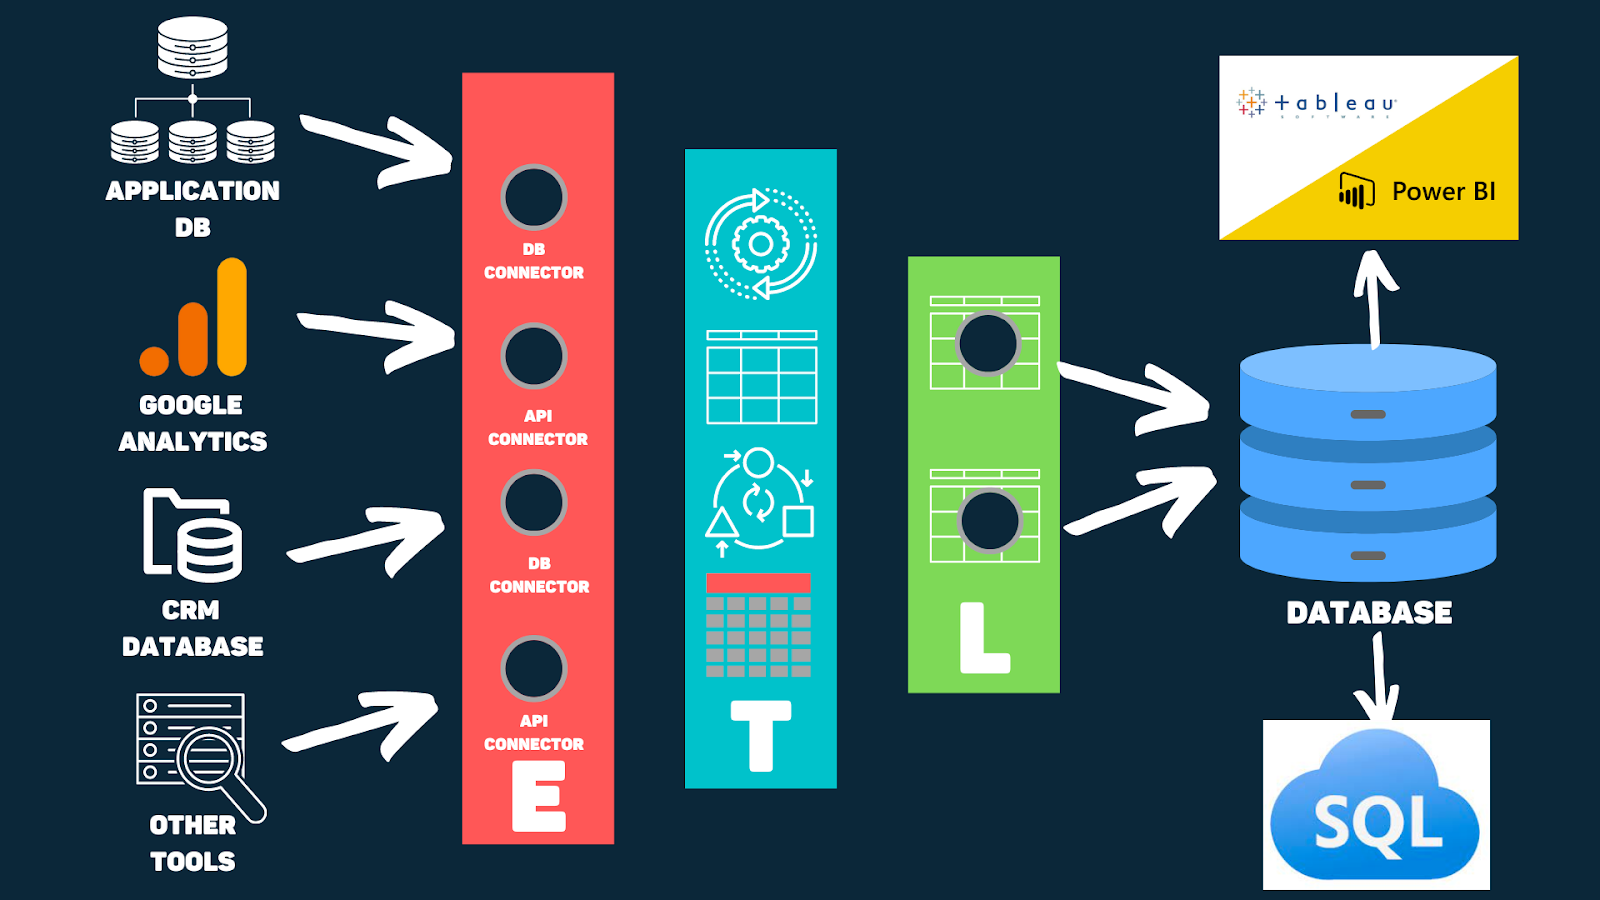
Any simple ETL Pipeline would first extract data from all the sources such as databases, APIs, files, and any other type of data connectors. Then comes the next step where it transforms the data. But what exactly does this step involve? For transforming this collected data, the system removes any ambiguities, missing fields, and columns with nulls. It further includes putting the misplaced columns into the right places, in the right format, joins or merges where it's needed, and sometimes it also brings out a pivot summary.
Finally, the last step is performed where this customized, transformed data is loaded into a sink. This ‘sink’ could simply be a database. Since this process is not just a one-time thing, it is likely that it will be repeated with a continuing frequency. Therefore, the data engineers make scripts that carry on the whole process of ETL to run on a weekly, monthly, or yearly basis. Airflow Orchestration is one good example of an ETL tool.
Insights for Stakeholders (BI)
Business Intelligence, abbreviated as BI, is software used to accumulate, process, analyze, and visually represent larger sets of unstructured data. They are used to inform decision-making and drive business outcomes. As fascinating as it sounds, BI tools are a great invention as they make it possible for everyone to observe and make sense of their own data.

Photo Credit: Tima Miroshnichenko/Pexels
BI tools are made for end-users like stakeholders and analysts who get access to the recorded insights. Using BI tools, they are able to track KPIs (Key Performance Indicators) and trends and make decisions on the basis of well-curated data. Some popular BI tools are PowerBI, Tableau, and Google Data Studio. These tools make it easier to create charts, graphs, and maps, and can easily be transported into excel sheets for future use.
Data Warehousing
We studied how ETL helps in consistently pushing the data forward each day. But there is a limit to how much data can be stored in a database like MySQL, and for how long. That’s when Data Warehouse comes into the picture.
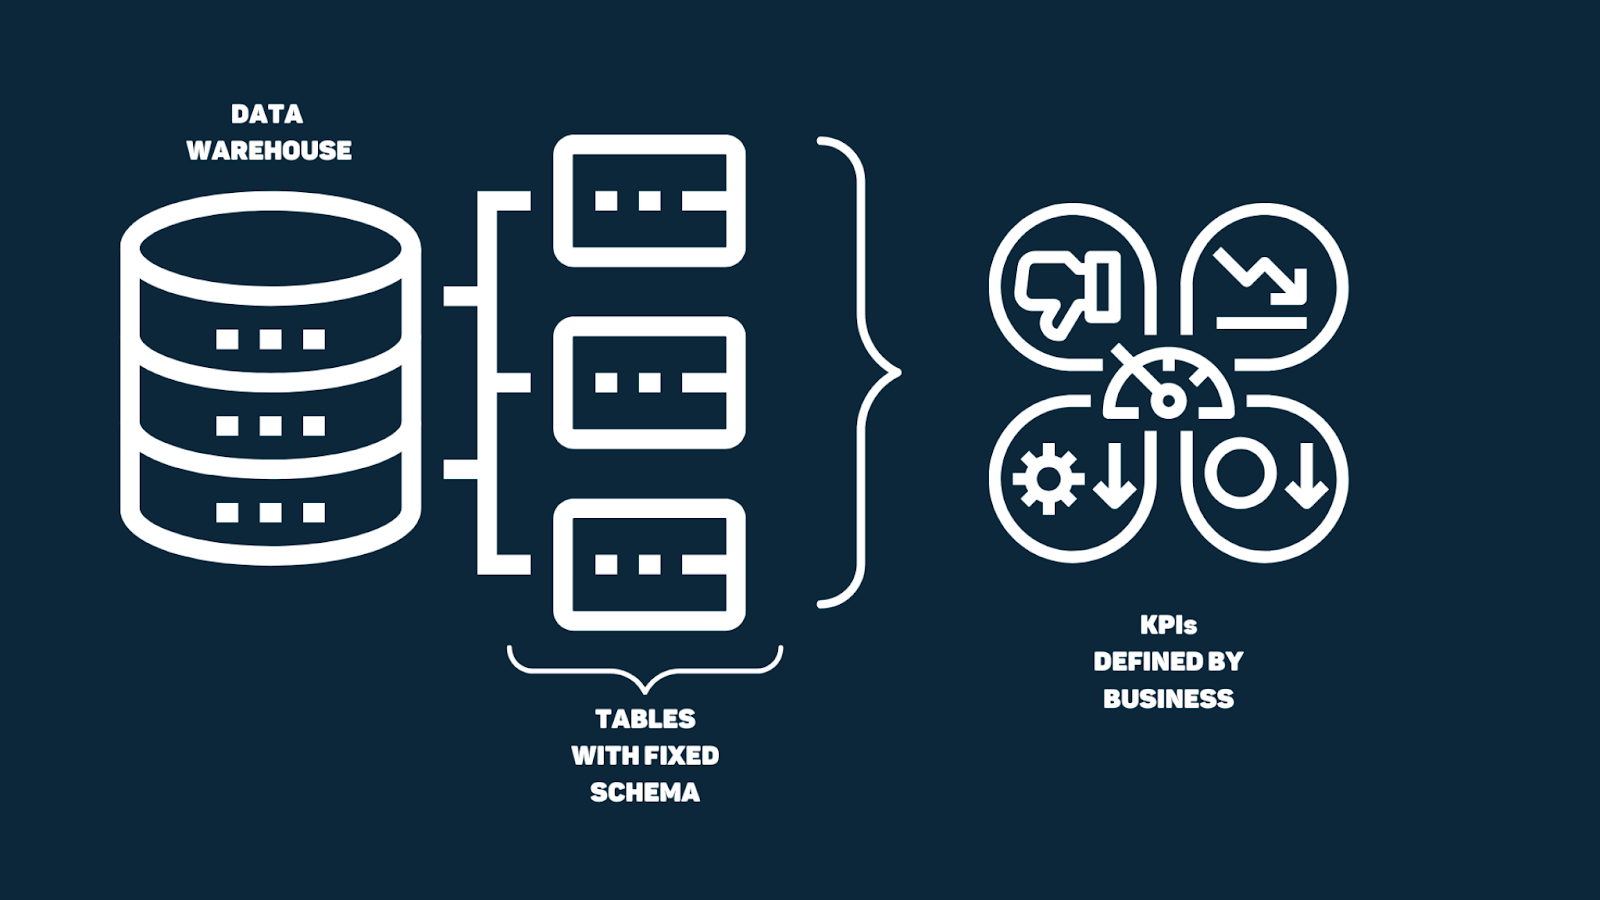
As its name suggests, this system works as a warehouse for data in larger amounts and often, to store historical data. Data stored in data warehouses is structured to cater to analytical workloads in mind. The schema is usually denormalized to fetch insights without doing a lot of joins. A data warehouse is also termed as OLAP DB system.
It mainly focuses on the analytical part as it supports in performing queries and analysis. In short, this is just another tool that helps big organizations to take mindful and strategic decisions using historical records and generating queries.
ELT/ Data Lake used by Data Scientists
The data warehouse is built to support the business requirements at the moment, it contains structures & well-designed schema. Business users need these to track KPIs and metrics.
However, Data Scientists are required to build ML models in order to make futuristic predictions based on existing data. Their part of the task is to hunt every square inch of data they can find. So they are also interested in looking at unstructured data such as logs, events data, which is not part of the warehouse.
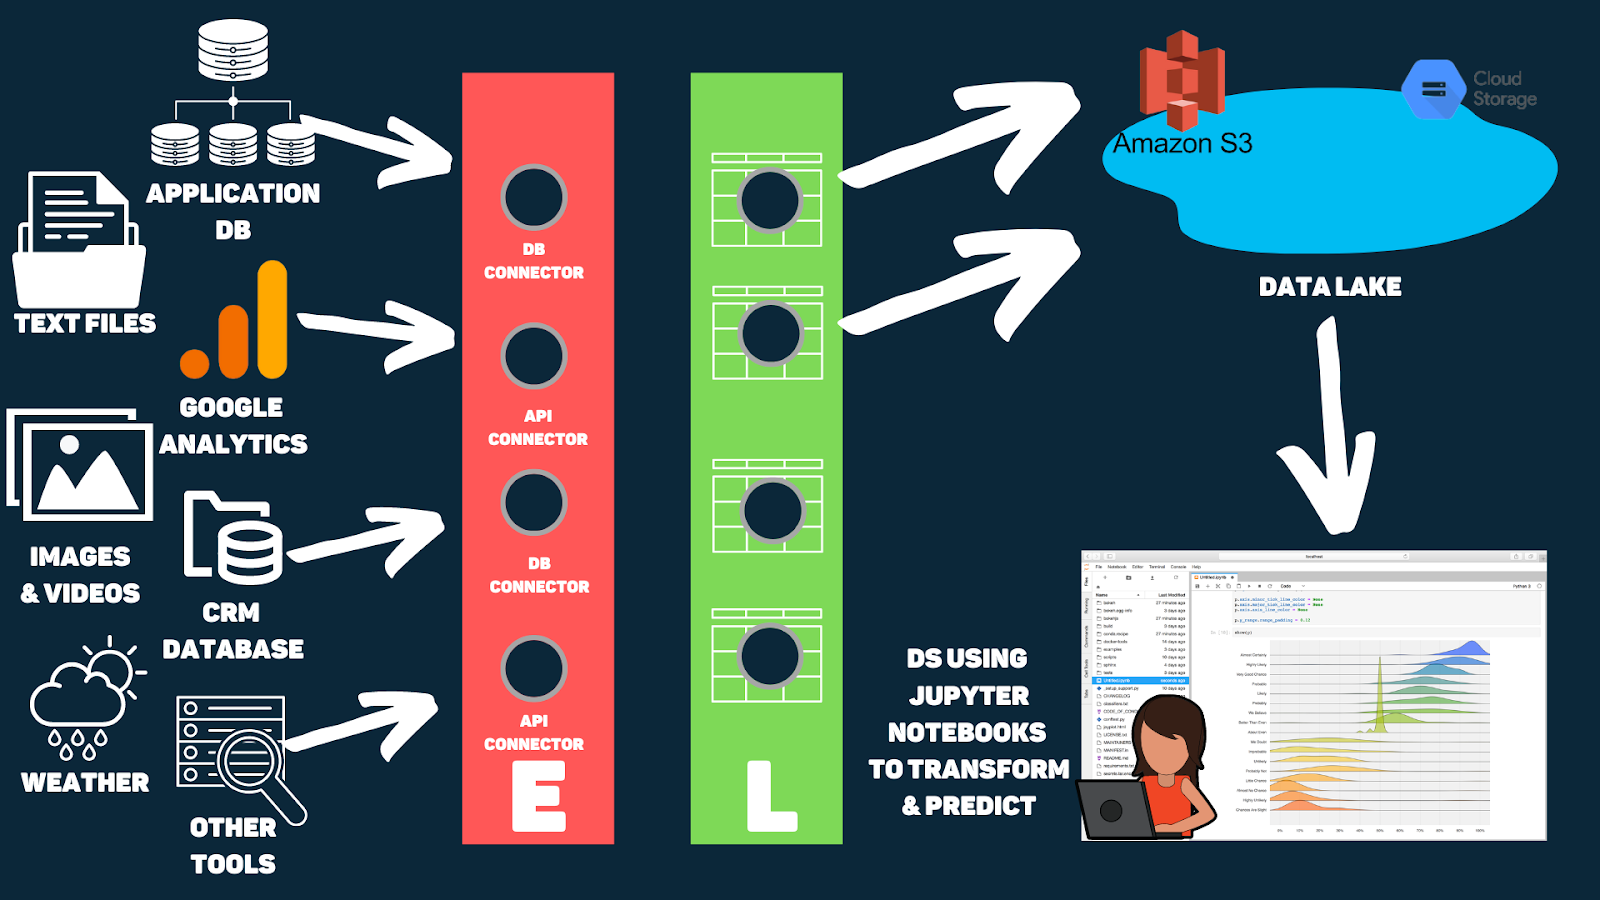
But to make all this possible, a Data Engineer has to do some work. Instead of ETL, they have to turn it into ELT. This means that extraction comes first and then loading of the data into a data lake happens. Data lake stores all the raw data without processing it as DS needs to see all the columns. This data is usually stored in blob storage like S3, HDFS, or GCS. At last, data scientists transform the data in Jupyter notebooks to churn out its usability.
Big Data & Computing Spark
Big Data was one of the most intriguing, overused buzzwords back then when it was first introduced in the world of data technology. But what do we mean when we use the term?
To be concise, the data which cannot be processed/used in a single server is called Big Data. But there is more to it!
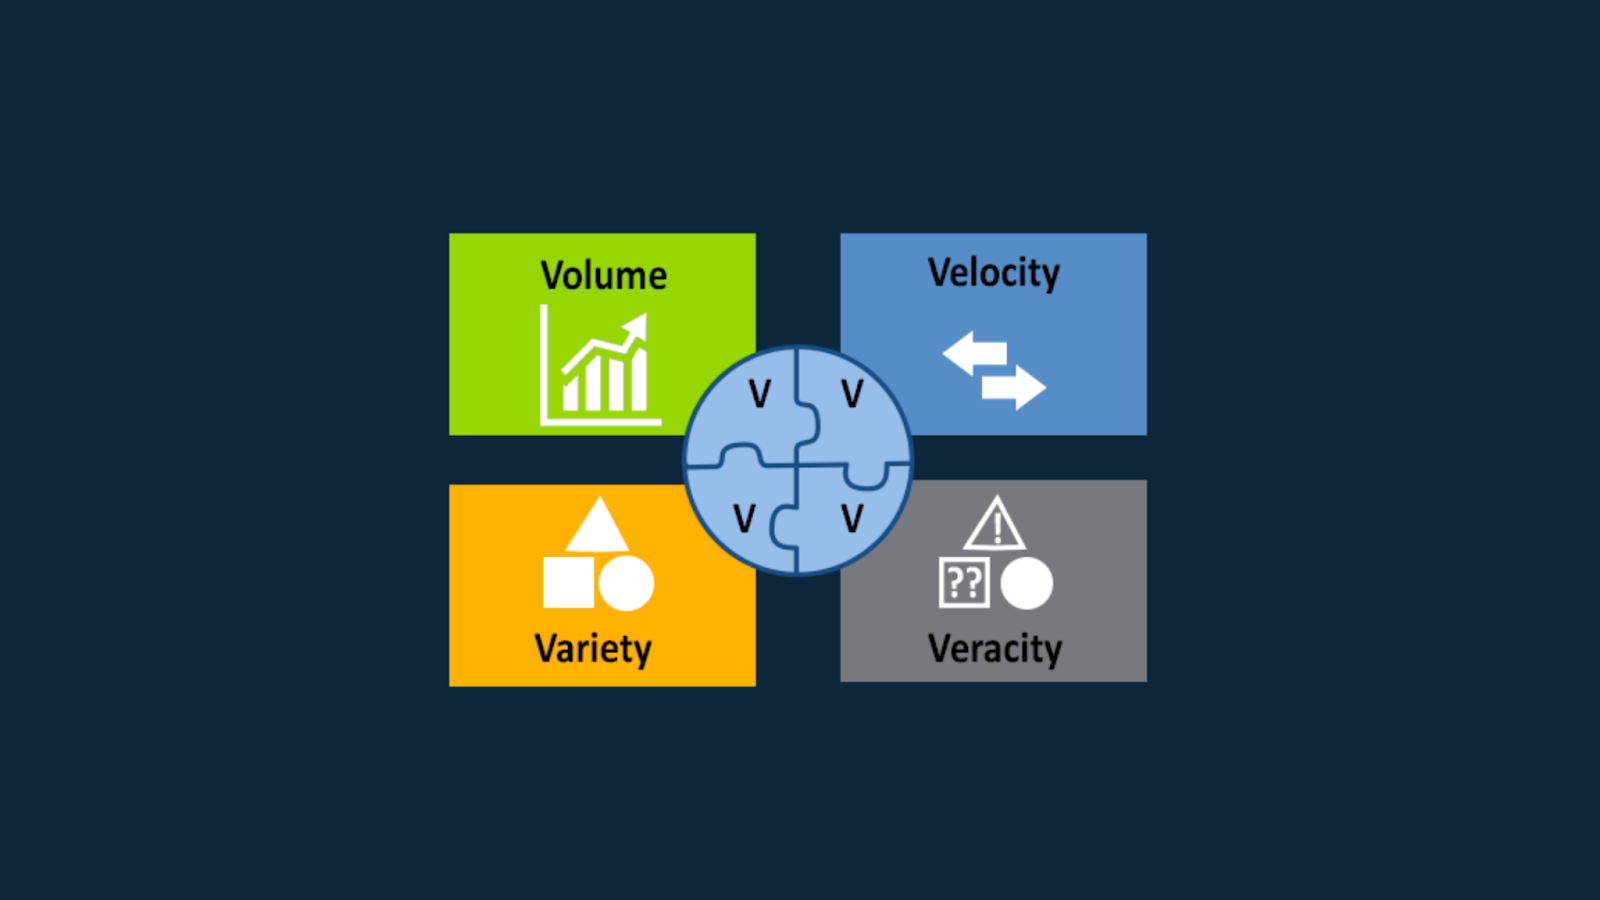
For data to be classified as big data, there are 4 Vs that are required:
Volume
Variety
Veracity (accuracy)
Velocity (speed)
Some of the key areas where big data comes to use are:
Ecommerce website doing thousands of sales and logistic transactions
Payment Systems
Financial Institutions
Blockchain Exchanges
Streaming Services like Youtube
The petabytes of data cannot be stored on a single server. Hence, this quantity of data is required to be distributed over other computing and cloud alternatives. For such a purpose, there are open source frameworks like Apache Hadoop, which efficiently stores and processes data that is very huge in volume. Such servers are also known as clusters as you can use as much storage as you need and compute.
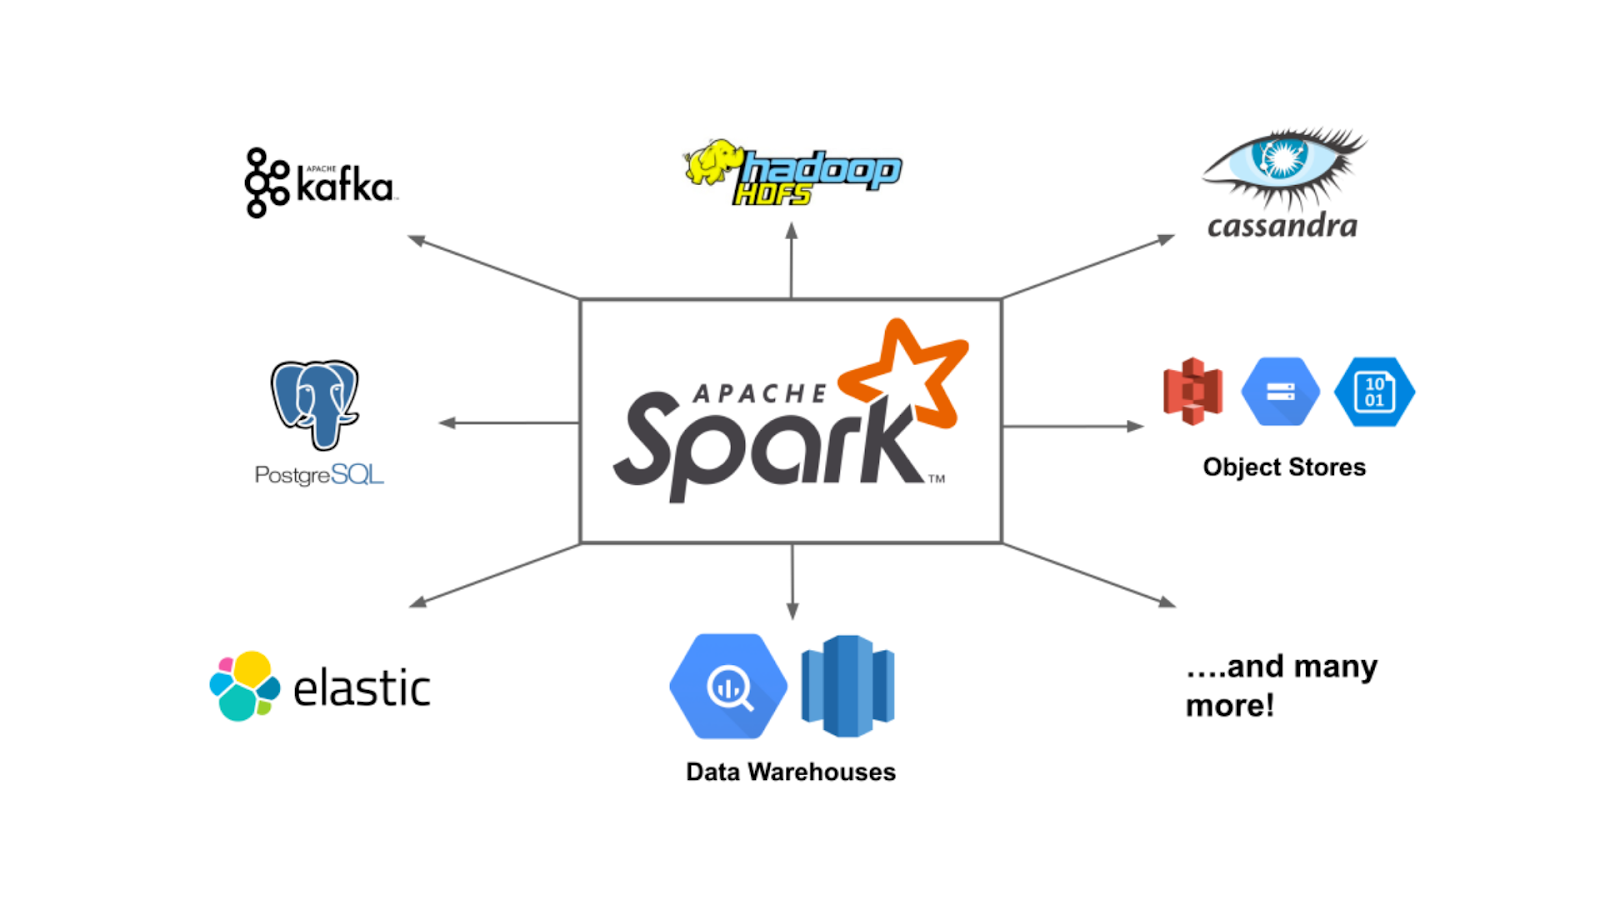
Some other great variants of these cloud storage support are GCS and S3, as they are more resilient. Such distributed storage provides scalability and redundancy, for the data can be retrieved if some server crashes in the future. In addition to this, some specific technologies come handy to work on the distributed computing and streaming of this stored data. Spark and Kafka are some good examples for it!
Conclusion
The world of data engineering is huge and includes major components of data science as well. This means that data engineering and data science are not contrasting but complementary to each other. Data engineers design and build the pipelines to transform and then transport the data into the desired format. At the same time, data scientists utilize that data to bring out most of its utility for the business organization and its stakeholders.
However, in order to complement each other’s efforts, both data engineers and data scientists are supposed to learn data literacy skills and must be well aware of their respective contributions to the system. This is how any business organization flourishes and performs well in the market, understands the likes & preferences of its consumer base, and makes important decisions that are crucial for growth.