Stackdriver on Google Cloud: The only logging solution you’ll ever need

I am a Data Engineer I love Python! I am based in Singapore I have good knowledge on cloud I have some knowledge on building Machine Learning Models I have helped 30+ companies use data effectively I have worked with Petabytes scale of data I write @ TowardsDataScience Nowadays I am focusing on learning Natural Language Processing Ask me about anything, I'll be happy to help.
I have always found logging a really big overhead, specially in the present micro-service era where everything is small and distributed. A solution like Stackdriver is way more efficient and effective to use compared to any other existing solution out there.
Understanding the Logging Principle
One of the many reasons that made me choose to implement logging and Monitoring of my Compute engines using Stackdriver is that all the tools are appropriately integrated. Before I started using it, I was using one tool for log aggregation, another tool for application performance monitoring, and another tool for crash reporting; to be honest, it was an issue moving from one platform to another. This was an annoying and time-consuming process, especially when I had to go through a pile of tools for Monitoring like Monit and Pingdom. The most painful part in all is when something goes wrong; almost everything turns red, and it’s tough to figure out what exactly was happening, and because I was receiving alerts simultaneously, it was hard pointing out the issue.
Stackdriver has a lot of functionalities built-in that makes it seamless to move from Monitoring to logging your app engines in one scalable and unified platform.
Why does logs matter?
When we look at anything related to troubleshooting distributed micro-services at its fundamental level, we will realize that it is a difficult process. Moving forward, The Cloud infrastructure has a bunch of interconnected entities, like a puzzle. So when something gets wrong, it is really complicated trying to sample out the problem and fixing them back together.
In this regard, log gives us visibility into our system. For instance, if we look at the puzzle analogy, while we can simply assemble or troubleshoot things individually, a centralized logging system in the cloud will allow you to see all of the pictures and missing details at the same time, which will help improve performance, reliability, and security of your log data.
Stackdriver Logging allows you to provide data, store, analyze, monitor log data and events from GCP and other platforms. It also has a fully enabled integration that works easily with cloud trace, error reporting, and cloud debugging. This connection allows you to move swiftly between traces, charts, errors, and logs across multiple cloud environments
Let us take a closer look at how we can implement Logging using Stackdriver
Implementing Logging
It is essential to know that Logging and Monitoring go together when working with Stackdriver. To get logs, we need to monitor what’s going on within our compute engines. So we shall set up our cloud monitoring with the following steps.
Install the logging agents (if logs will be coming from multiple sources)
Cloud Logging agents function by allowing metrics and logs to move from your compute to monitoring and logging functions. Google-Fluentd logging agent installed in each VM is relied upon by google to stream logs from multiple sources to be viewed in the Stackdriver log viewer.
Kubernetes Engine / App Engine
If your VMs are running in Google Kubernetes Engine or App Engine, the agent is already included in the VM image.
Compute Engine
You can install logging agents on compute engine with just these two shell commands.
curl -sSO https://dl.google.com/cloudagents/install-logging-agent.sh
sudo bash install-logging-agent.sh --structured
Or these commands could be part of your startup shell script
Logging agent configuration (No additional configuration is required)
The Logging agent google-fluentd is a modified version of the fluentd log data collector. The Logging agent comes with a default configuration; in most common cases, no additional configuration is required.
This means most of the use cases are already covered and the logging is happening by default, this is because of the default fluentd configuration files. Fleuntd covers a lot of logs from different services like syslogs, apache, mysql, nginx, jenkins and many more. You can find a list here: Default Logging agent logs | Cloud Logging | Google Cloud This page lists the logs that are sent to Cloud Logging by the Logging agent. The next major version of the Logging…cloud.google.com
If you are using these services, you’ll be able to see the logs in Log Viewer as soon as you install the logging agent
Enabling logs in Docker container
This is actually one the most used configuration in my case as all of my micro-services are configured with docker.
In your docker run command just add the following argument.
--log-driver=gcplogs
This runs on any pre-defined image or your custom image.
Viewing Logs
Now that the configurations are setup, you’ll be able to see all the incoming logs at Logging > Logs Viewer in your google cloud console.
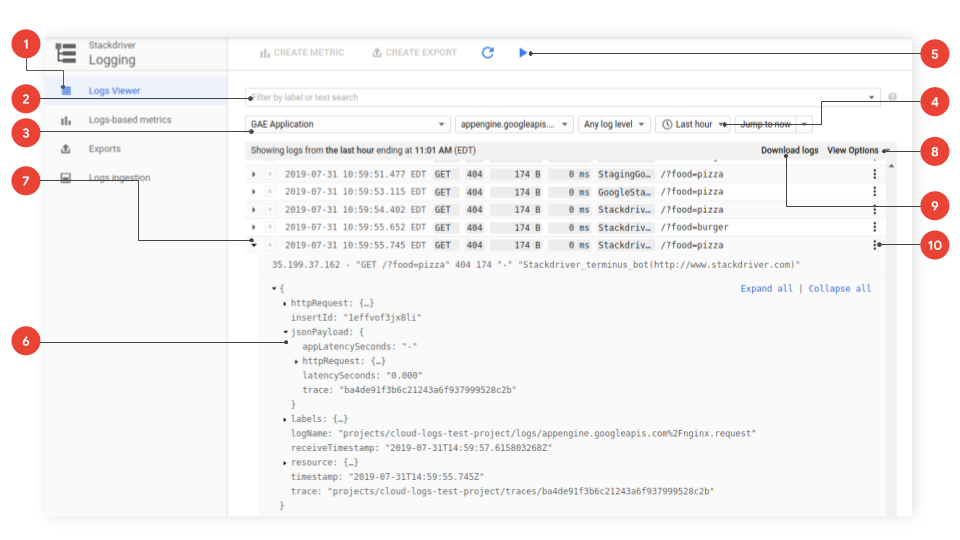 Image from official google cloud logging documentation
The basic query interface has the following major components — indicated by red numbers in the screenshot above — some of which are shared with the advanced query interface:
The window tabs let you stay on Logs (the Logs Viewer page), or choose between other Logging features: Metrics (see Logs-based metrics), Exports (see Exporting with the Logs Viewer), and Logs ingestion (see Logs exclusions).
The search-query box in the basic query interface lets you query log entries by label or text search.
The basic selector menu lets you choose resources, logs, and severity levels to display: Resources: The resources available in your current project. Logs: The log types available for the current resources in your project. Log severity: The log severity levels.
The time-range selector drop-down menus let you query for specific dates and times in the logs.
The streaming selector, at the top of the page, controls whether new log entries are displayed as they arrive. The log-entry table contains the log entries available according to your current queries and custom fields.
The expander arrow (▸) in front of each log entry lets you look at the full contents of the entry. For more information, see Expand log entries.
The View Options menu, at the far right, has additional display options.
The Download logs menu, at the far right, lets you download a set of log entries. For details, see download log entries.
The idea is just you can create custom filters based on text search or attributes. It is easy to wrap your head around it, quite similar to SQL
Monitoring
Cloud Monitoring collects measurements to help you understand how your applications and system services are performing. A collection of these measurements is generically called a metric. Monitoring is the final layer to glue all the logs together to make sense.
The following 3 parts are essential to setup monitoring
Uptime checks
As you are working on your cloud compute engines, you need to know that your web servers are accessible from any location you want. That’s precisely what uptime checks does; it verifies and notifies you if the uptime checks encounter a problem.
It’s straightforward to create an uptime check; go to Monitoring on your Google Cloud project. Create uptime checks and complete the following fields.
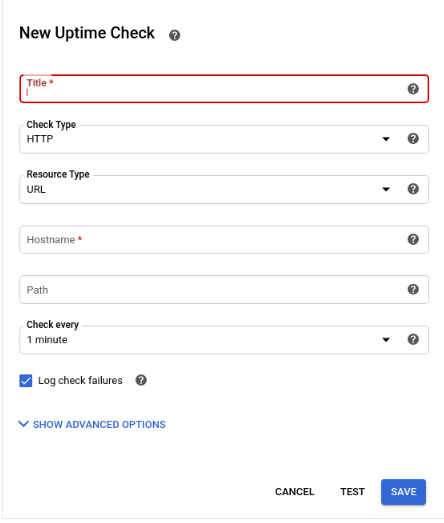 Image from official google cloud documentation
Ensure that your servers are properly installed to avoid “connection error refused” messages when running a test if your uptime checks are working. Click Save to complete setting up your uptime checks.
Alerting policies
Alerting gives timely awareness to problems in your cloud applications so you can resolve the problems quickly. To create an alerting policy, you must describe the circumstances under which you want to be alerted and how you want to be notified.
How it works?
Conditions that identify an unhealthy state for a resource or a group of resources. The conditions for an alerting policy are continuously monitored.
Notifications sent through email, SMS, or other channels to let your support team know a resource is unhealthy.
When events trigger conditions in one of your alerting policies, Cloud Monitoring creates and displays an incident in the Google Cloud Console. If you set up notifications, Cloud Monitoring also sends notifications to people or third-party notification services.
As an example an alert facility can be something described below. You have to use the monitoring panel to setup something like this
If HTTP response latency is higher than two seconds,
and if this condition lasts longer than five minutes,
open an incident and send email to your support team.
To set it up go to Alerting tab, you will see a tab which requires you to fill in conditions and add a notification channel .

A condition can be related to resource usage like CPU, memory, etc or something like uptime check, it really depends on the requirement.

After that click on save. This will setup the alert and will send notification if conditions fail
Dashboard
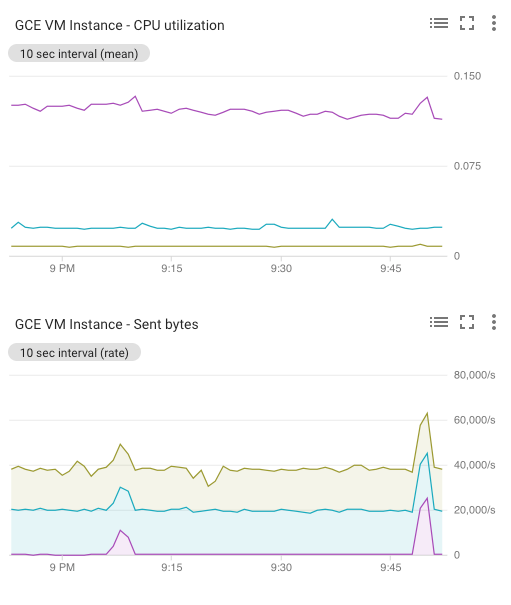
After Monitoring, you will want to display metrics and logs collected. To create a dashboard, go to Monitoring and select Dashboards and then click create a dashboard. Choose a name for your dashboard and click confirm. Add selection to chart and ensure the Metric tab is selected. Click save to complete the process. As a start you can create the following charts
CPU Utilization
Memory Utilization
Received/Sent bytes over network
Conclusion
With microservices going mainstream, understanding how to implement Stackdriver monitoring and logging capabilities will help developers optimize their productivity, reliability, and the security of their working environment.